Most important system performance analysis transactions
Following is a list of the few most important performance analysis transactions and brief explanation of their purpose of various systems (BW, ECC, SCM, SRM, ERP, CRM etc)
ST02
SAP Memory Configuration monitor checks the SAP Buffers and SAP Memory areas for problems such as swapping. Here we can check the utilization of SAP shared buffers, extended, roll, paging and heap memory can be obtained from the SAP memory configuration monitor

ST03N:
General performance statistics such as response time. This workload monitor can show response time daily/weekly/monthly and is mainly used for checking dialog/background/update/spool/rfc response times


ST04:
It gives a picture of databuffer/cache quality, SQL cache catalog/pin ratio. For further detailed analysis click button 'Detail Analysis Menu'

ST06:
The Operating System Monitor is used as a snapshot of CPU utilization, RAM, Swap space. For further detailed analysis click button 'Detail Analysis Menu'

SM66:
Mainly used for monitoring current system activity via the Global Work Process Overview

ST22:
It’s a store for ABAP Dumps such as –
TSV_TNEW
DBIF_RSQL_SQL_ERROR
DBIF_RSQL_INVALID_SQL_ERROR
TSV_INDEX_INDEX_NO_ROLL_MEMORY
SYSTEM_NO_ROLL
SYSTEM_ROLL_IN_ERROR
TABLE_HASH_NO_MEMORY
STORAGE_HASH_NO_MEMORY
STORAGE_PARAMETERS_WRONG_SET
SAPSQL_ARRAY_INSERT_DUPREC
SM21:
All remote system lock
System locks
Failed logon attempts
Look for messages like: -
Process message
Printer problems
Signal 11
Short dumps
Time-outs
Matchcode problems
Aborted postings
SM04:
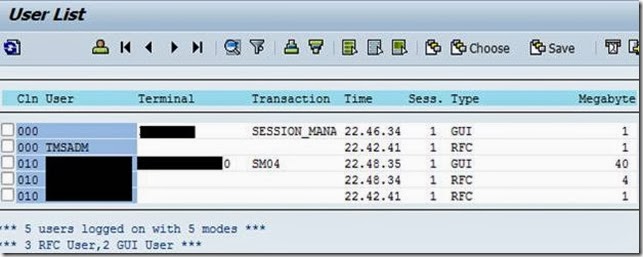
Active Users and its sessions. Also check memory, page, roll, priv usage via goto –>memory
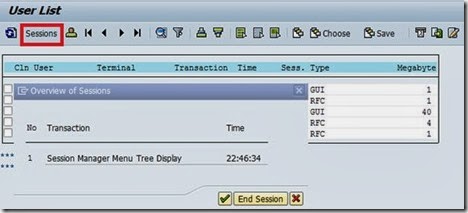
By clicking on session, we can have detailed analysis. If we want we can end user session from here.
AL08:
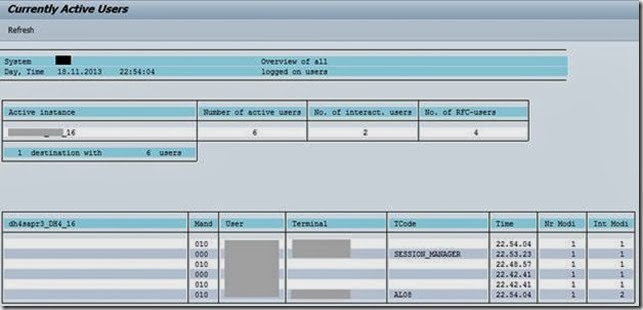
The number of active users can be obtained from the Global User Monitor
SARFC: An overview of server resources and under column description whether there is a problem
AL11: List of SAP directories

DB01: It gives idea about exclusive wait situations using the Database Lock Monitor.
We can see number of deadlock along with table name
DB02: Check database growth, freespace in tablespaces, critical objects, extents of tables and indexes

We can get current size of tablespaces by clicking “current size”

DB12: Check backup/restore situation

DB16: On Oracle check for search for messages with the "SEVERITY" type "E" (error) that occurred in the past 4 weeks.

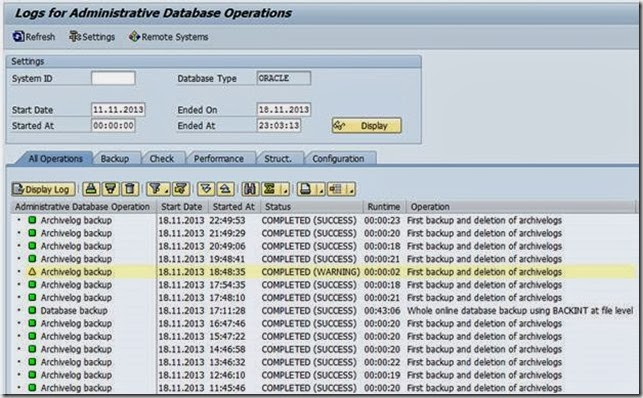
DB24: Check administration tasks such as backup/recovery, archive frequency, administration tasks
Report /SDF/MON: The tool allows for the collection of data on CPU Utilization,Memory Management, Database Performance, Work Process Utilization, Workload, STAD, RFC etc. The information linked with each of the above areas is stored in the database for further usage. The data can be collected for predefined periods of time and for a set frequency of seconds STAD: Used to check response time of programs/transactions and provides various levels of detail which can be tailored.
ST14: The ST14 application monitor is mainly used during SAP GoingLive session. Analysis batch jobs collect performance-relevant key figures such as document statistics and customizing settings, the analysis results can be viewed as a tree and downloaded to a service session. See SAP Note 69455.
ST05: ST05 traces every action of a user on a server. SQL trace needs to be switched off and the ST05 writes trace files into the local filesystem and overwrites them circularly.

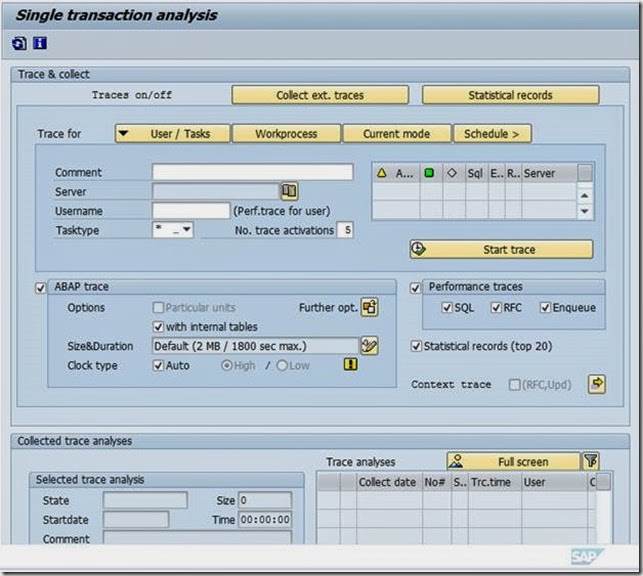
ST12: ST12 combines ABAP and performance (SQL) trace into one transaction, with major functional enhancements especially for the ABAP trace part. In a joint switch on/off with the performance trace, ST12 allows to activate the ABAP trace for another user. See Note 755977. The ST12 can also be used for tracing workprocess, program/transaction or a user. At a click of a button you can view the SQL and ABAP trace information.
Other useful transactions that can be used depending on circumstances: SM58 SM59 SMQ1 SMQ2 SMGW SDCCN SM37 SM51 SM50 RZ04 RZ10 RZ20 SE16 SE12 TU02 DB03 SMQS DB21 SMQR SM13
Discuss with your developers/programmers if performance improvements are possible. For performance problems caused by customer programs SAP offers SAP Customer Program Optimization (http://service.sap.com/cpo) by eliminating costly performance bottlenecks by tuning critical customer programs.
Also ensure you have setup Earlywatch Alert as per SAP Note 207223. A good starting point for performance documentation is:
http://service.sap.com/performance
http://service.sap.com/earlywatch
http://service.sap.com/goinglivecheck
http://service.sap.com/safeguarding -
Source: http://www.saptechies.org
Following is a list of the few most important performance analysis transactions and brief explanation of their purpose of various systems (BW, ECC, SCM, SRM, ERP, CRM etc)
ST02
SAP Memory Configuration monitor checks the SAP Buffers and SAP Memory areas for problems such as swapping. Here we can check the utilization of SAP shared buffers, extended, roll, paging and heap memory can be obtained from the SAP memory configuration monitor

ST03N:
General performance statistics such as response time. This workload monitor can show response time daily/weekly/monthly and is mainly used for checking dialog/background/update/spool/rfc response times


ST04:
It gives a picture of databuffer/cache quality, SQL cache catalog/pin ratio. For further detailed analysis click button 'Detail Analysis Menu'

ST06:
The Operating System Monitor is used as a snapshot of CPU utilization, RAM, Swap space. For further detailed analysis click button 'Detail Analysis Menu'

SM66:
Mainly used for monitoring current system activity via the Global Work Process Overview

ST22:
It’s a store for ABAP Dumps such as –
TSV_TNEW
DBIF_RSQL_SQL_ERROR
DBIF_RSQL_INVALID_SQL_ERROR
TSV_INDEX_INDEX_NO_ROLL_MEMORY
SYSTEM_NO_ROLL
SYSTEM_ROLL_IN_ERROR
TABLE_HASH_NO_MEMORY
STORAGE_HASH_NO_MEMORY
STORAGE_PARAMETERS_WRONG_SET
SAPSQL_ARRAY_INSERT_DUPREC
SM21:
All remote system lock
System locks
Failed logon attempts
Look for messages like: -
Process message
Printer problems
Signal 11
Short dumps
Time-outs
Matchcode problems
Aborted postings
SM04:
Active Users and its sessions. Also check memory, page, roll, priv usage via goto –>memory

By clicking on session, we can have detailed analysis. If we want we can end user session from here.

AL08:
The number of active users can be obtained from the Global User Monitor

SARFC: An overview of server resources and under column description whether there is a problem
AL11: List of SAP directories

DB01: It gives idea about exclusive wait situations using the Database Lock Monitor.
We can see number of deadlock along with table name
DB02: Check database growth, freespace in tablespaces, critical objects, extents of tables and indexes

We can get current size of tablespaces by clicking “current size”

DB12: Check backup/restore situation

DB16: On Oracle check for search for messages with the "SEVERITY" type "E" (error) that occurred in the past 4 weeks.

DB24: Check administration tasks such as backup/recovery, archive frequency, administration tasks

Report /SDF/MON: The tool allows for the collection of data on CPU Utilization,Memory Management, Database Performance, Work Process Utilization, Workload, STAD, RFC etc. The information linked with each of the above areas is stored in the database for further usage. The data can be collected for predefined periods of time and for a set frequency of seconds STAD: Used to check response time of programs/transactions and provides various levels of detail which can be tailored.
ST14: The ST14 application monitor is mainly used during SAP GoingLive session. Analysis batch jobs collect performance-relevant key figures such as document statistics and customizing settings, the analysis results can be viewed as a tree and downloaded to a service session. See SAP Note 69455.
ST05: ST05 traces every action of a user on a server. SQL trace needs to be switched off and the ST05 writes trace files into the local filesystem and overwrites them circularly.

ST12: ST12 combines ABAP and performance (SQL) trace into one transaction, with major functional enhancements especially for the ABAP trace part. In a joint switch on/off with the performance trace, ST12 allows to activate the ABAP trace for another user. See Note 755977. The ST12 can also be used for tracing workprocess, program/transaction or a user. At a click of a button you can view the SQL and ABAP trace information.

Other useful transactions that can be used depending on circumstances: SM58 SM59 SMQ1 SMQ2 SMGW SDCCN SM37 SM51 SM50 RZ04 RZ10 RZ20 SE16 SE12 TU02 DB03 SMQS DB21 SMQR SM13
Discuss with your developers/programmers if performance improvements are possible. For performance problems caused by customer programs SAP offers SAP Customer Program Optimization (http://service.sap.com/cpo) by eliminating costly performance bottlenecks by tuning critical customer programs.
Also ensure you have setup Earlywatch Alert as per SAP Note 207223. A good starting point for performance documentation is:
http://service.sap.com/performance
http://service.sap.com/earlywatch
http://service.sap.com/goinglivecheck
http://service.sap.com/safeguarding -
Source: http://www.saptechies.org


Post a Comment
Any difficult to understand and implement this then don’t hesitate to ask me via comments Your comments are always appreciated except spam.