Featured

SMLG load balancing


What’s the use of SMLG load balancing?
Dynamic logon load distribution should ensure that the load is distributed as evenly as possible over all available application servers in a logon group. To achieve this, a program runs automatically every five minutes, determines the logon quality for each application server, and writes the quality to a table on the message server. This quality is a numerical value that is calculated from various performance values, such as the number of users logged on and the response time. The server with the best quality within a logon group is used for the next logon
Log on load balancing is configured when we have more number of application servers.
Advantage of SMLG load balancing:
Effective utilization of buffers.
Failover and Load balancing
Effective utilization of resources/work process

Most important SAP system performance analysis transactions

Most important system performance analysis transactions
Following is a list of the few most important performance analysis transactions and brief explanation of their purpose of various systems (BW, ECC, SCM, SRM, ERP, CRM etc)
 
ST02
SAP Memory Configuration monitor checks the SAP Buffers and SAP Memory areas for problems such as swapping. Here we can check the utilization of SAP shared buffers, extended, roll, paging and heap memory can be obtained from the SAP memory configuration monitor
 
clip_image002
 
ST03N:
General performance statistics such as response time. This workload monitor can show response time daily/weekly/monthly and is mainly used for checking dialog/background/update/spool/rfc response times
clip_image004
 
clip_image006
 
ST04:
It gives a picture of databuffer/cache quality, SQL cache catalog/pin ratio. For further detailed analysis click button 'Detail Analysis Menu'
 
clip_image008
 
ST06:
The Operating System Monitor is used as a snapshot of CPU utilization, RAM, Swap space. For further detailed analysis click button 'Detail Analysis Menu'
clip_image010
 
SM66:
Mainly used for monitoring current system activity via the Global Work Process Overview
 
clip_image012
 
ST22:
It’s a store for ABAP Dumps such as –
TSV_TNEW
DBIF_RSQL_SQL_ERROR
DBIF_RSQL_INVALID_SQL_ERROR
TSV_INDEX_INDEX_NO_ROLL_MEMORY
SYSTEM_NO_ROLL
SYSTEM_ROLL_IN_ERROR
TABLE_HASH_NO_MEMORY
STORAGE_HASH_NO_MEMORY
STORAGE_PARAMETERS_WRONG_SET
SAPSQL_ARRAY_INSERT_DUPREC
 
SM21:
All remote system lock
System locks
Failed logon attempts
Look for messages like: -
Process message
Printer problems
Signal 11
Short dumps
Time-outs
Matchcode problems
Aborted postings
 
SM04:
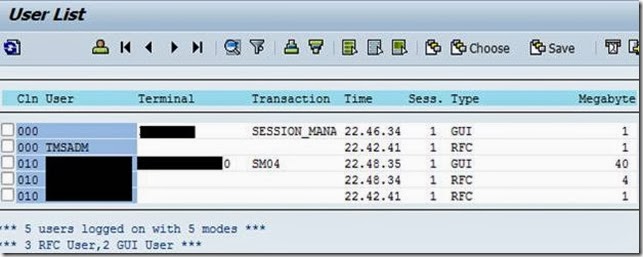
Active Users and its sessions. Also check memory, page, roll, priv usage via goto –>memory
 
clip_image014
 
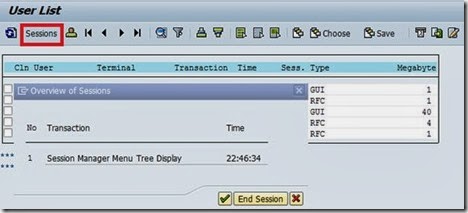
By clicking on session, we can have detailed analysis. If we want we can end user session from here.
 
clip_image016
 
AL08:
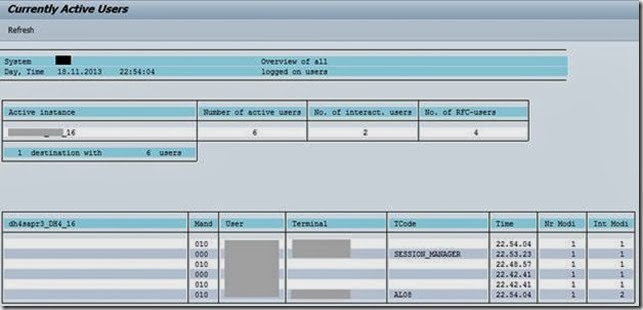
The number of active users can be obtained from the Global User Monitor

clip_image018
 
SARFC: An overview of server resources and under column description whether there is a problem
 
AL11: List of SAP directories
 
clip_image020
 
DB01: It gives idea about exclusive wait situations using the Database Lock Monitor.
We can see number of deadlock along with table name
 
DB02: Check database growth, freespace in tablespaces, critical objects, extents of tables and indexes
 
clip_image022
 
We can get current size of tablespaces by clicking “current size”
 
clip_image024
 
DB12: Check backup/restore situation
 
clip_image026
 
DB16: On Oracle check for search for messages with the "SEVERITY" type "E" (error) that occurred in the past 4 weeks.
 
clip_image028
 
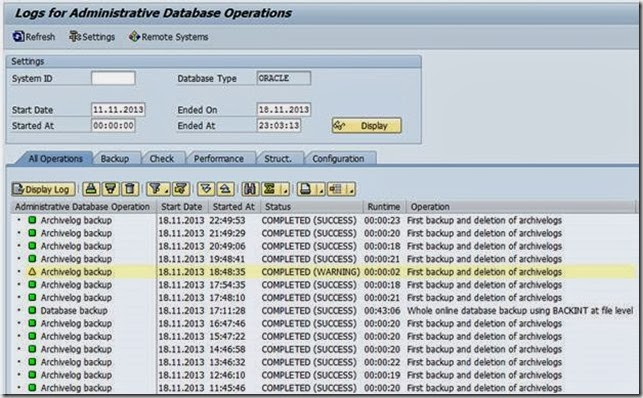
DB24: Check administration tasks such as backup/recovery, archive frequency, administration tasks
 
clip_image030
 
Report /SDF/MON: The tool allows for the collection of data on CPU Utilization,Memory Management, Database Performance, Work Process Utilization, Workload, STAD, RFC etc. The information linked with each of the above areas is stored in the database for further usage. The data can be collected for predefined periods of time and for a set frequency of seconds STAD: Used to check response time of programs/transactions and provides various levels of detail which can be tailored.
 
ST14: The ST14 application monitor is mainly used during SAP GoingLive session. Analysis batch jobs collect performance-relevant key figures such as document statistics and customizing settings, the analysis results can be viewed as a tree and downloaded to a service session. See SAP Note 69455.
 
ST05: ST05 traces every action of a user on a server. SQL trace needs to be switched off and the ST05 writes trace files into the local filesystem and overwrites them circularly.
 
clip_image032
 
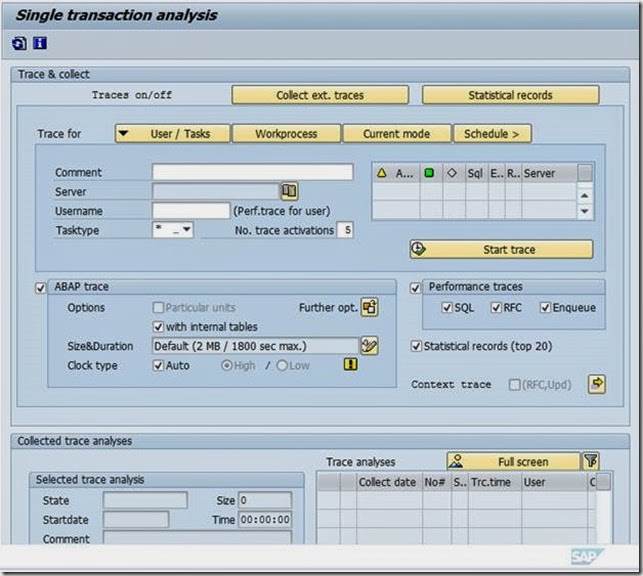
ST12: ST12 combines ABAP and performance (SQL) trace into one transaction, with major functional enhancements especially for the ABAP trace part. In a joint switch on/off with the performance trace, ST12 allows to activate the ABAP trace for another user. See Note 755977. The ST12 can also be used for tracing workprocess, program/transaction or a user. At a click of a button you can view the SQL and ABAP trace information.
 
clip_image034
 
Other useful transactions that can be used depending on circumstances: SM58 SM59 SMQ1 SMQ2 SMGW SDCCN SM37 SM51 SM50 RZ04 RZ10 RZ20 SE16 SE12 TU02 DB03 SMQS DB21 SMQR SM13
 
Discuss with your developers/programmers if performance improvements are possible. For performance problems caused by customer programs SAP offers SAP Customer Program Optimization (http://service.sap.com/cpo) by eliminating costly performance bottlenecks by tuning critical customer programs.
Also ensure you have setup Earlywatch Alert as per SAP Note 207223. A good starting point for performance documentation is:
http://service.sap.com/performance
http://service.sap.com/earlywatch
http://service.sap.com/goinglivecheck
http://service.sap.com/safeguarding -
Source: http://www.saptechies.org

ST22 (ABAP) Errors


Transaction code ST22 is used to lists the ABAP dumps generated in the system, we can restrict for a date, user as required. This each record indicates the reason for the error, transaction code, variables that caused the error. The types of error can be of various kinds for which action is to be taken to fix this error from happening again after analysis
An ABAP program can be terminated during its runtime for a number of different reasons. The database table SNAPTID lists all existing runtime errors (in total, around 1900).
To allow clearer processing, the runtime errors are divided into categories:

Internal errors Error in the VM -> can only be reported to SAP using an error message.
Errors in the ABAP runtime
Errors in the screen runtime
Errors in the database interface

The system was able to roughly determine the area in which the error occurred. Next, clarify whether it was triggered by an internal error or by a programming error.
ABAP programming errors Errors in the ABAP program, such as a division by zero or a catchable exception that was not caught.
Installation errors These include, for example, inconsistencies between the kernel and the database. A typical installation error is therefore the error
START_CALL_SICK
Resource bottleneck Typical example: SYSTEM_NO_ROLL. The application no longer has sufficient memory available.
External errors The error was caused by a call outside the system.
Example:
● The code page of the operating system does not match the SAP system language
● An incorrect logon attempt occurred when calling outside the SAP system (for example, RFC SDK).


End user errors These errors include, for example, incorrect end user printer settings.
No error The program was not terminated due to an error, but rather due to deliberately performed actions.
Example: If an administrator actively cancels a running transaction, the RABAX SYSTEM_CANCELED is thrown. In cases like this, no error correction is required.
ST runtime errors The error occurred during a Simple Transformation (ST). The cause is a programming error in the ST program.
Internal ST errors The error occurred during a Simple Transformation (ST). There is an internal error in the ST VM.
XSLT runtime errors The error occurred during the execution of an XSLT transformation.
ITS errors The error occurred in ITS. These are usually HTMLB errors, however the error could also be due, for example, to a resource error within the ITS.

If you read the entire dump carefully you may notice the following information
1) UserID through which abap dump was resulted
2) Terminal-id from which above user has logged it.
     Using this terminal id you may resolve the ip address using the following command
         ping <terminal-id>
3) Reason of the dump. Which program resulted in the dump
Note
Do you know that the old version of transaction code ST22 is RST22.

SAP Daily Monitoring T-Codes and its description

Here I have listed down few Tcodes which is usually monitored in almost every SAP Landscape
Daily Monitoring T-Codes
SM51

Check number of instances with status will display the SAP servers and you can select the particular server and check the work process running on that application server on clicking on any work process it will take you to that application server.

clip_image002
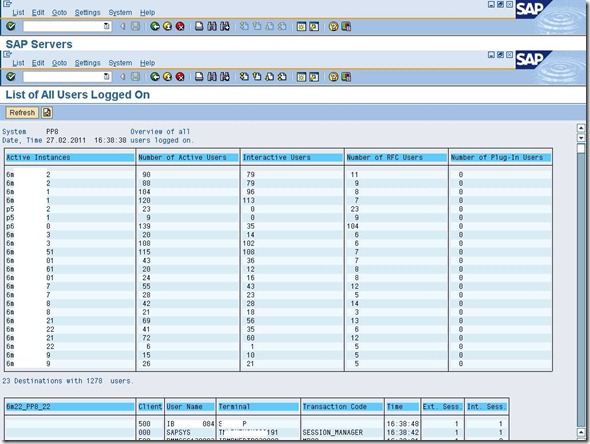
AL08

Check number of active users. If it exceeds the threshold limit, take action
Shows the list of all the users who are logged on to the system globally or for all the instances in the system which are active
clip_image004
SM12

List of number of lock entries. Long pending lock entry by user > 2hrs except for system jobs.
In a system whenever a user performs any update on any table for that period of time a lock on that particular field of that table is created so that no other user can update that table as user one is doing update on that table.
And suppose during the update user session get terminated due to some error then this lock entry remains on that field. From this Screen we can check those type of locks.

  1. Run T-Code SM12  “Select Lock Entry” window will come
  2. Change the User name to “*” because we have to report for all users and click on list button from top or press F8.


clip_image006
SM13

Total number of Error updates/ Updates, Please immediately intimate to user about update termination
If number of updates exceeds the limit, take action
Check:

  • Is the update active? If not, was it deactivated by the system or by a user?
  • Have any updates been canceled (with status Error)? (Make sure that you enter "*" in the user field.)
  • Is there a long queue of pending updates older than 10 minutes?


clip_image008
SM21

Check System log. Specify problems/action taken
Go to tcode SM21. In the menu, follow the following
Path:
System Log ---> Choose---> All remote system logs.

 
clip_image010
clip_image012
DB02OLD

Name of the tablespaces with <5 GB and the action taken. Check for tablespace PSAPBTABD & PSAPBTABI
When we go for DB02OLD for tablespace history for the table PSAP<SID>.which is displaying unconverted format in used space in delta column the unconverted format is displaying after the number.
clip_image014
clip_image016
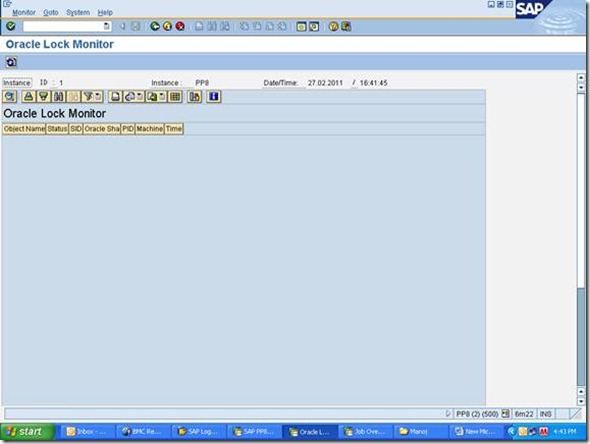
DB01

Number of deadlock along with Table Name if any deadlock for more that 600 sec then remove the deadlock
DB01 shows Exclusive HOLDs and Exclusive WAITs situations.
HOLD & WAIT situation occur when a resource is held by a user/process exclusively which is called a HOLD, and another process is trying to access it and goes to a WAIT situation.
We need to take care when locks are holding for a long time, and when it leads to a deadlock situation.
clip_image018
SM37

Total numbers of active jobs & check any ready status job, if anything found take action and monitor the delay jobs and take action
Once you create a job via SM36 or via some programs, the jobs will be coming under Scheduled job.
If you submit a job via program, the job will be released automatically. but if you schedule a job then SM36 , it'll be under scheduled and u have to release that job to run--you can see release button
Once you release that job , it'll go to active state and then finished or if any issues come , it'll be under cancelled..
Scheduled- Released- Ready- Active- Finished- Canceled
these are all for users to see the job, I mean the Job status. This whole cycle will be run automatically. You need to release the Job that's it.
clip_image020
clip_image022
clip_image024
clip_image026
SPAD

Total No. of Spool request > Threshold –take action spool errors if any check reasons check for spool waiting for printing
The SAP spool system manages its own output devices. This includes mostly printers, but also fax and archiving devices. In order for you to use output devices defined in your operating system from the SAP System, you must define these devices in the SAP spool system.
clip_image028
clip_image030
SMLG

List the name of the Server having Response time> 2 Sec
Go to transaction SMLG, and than go to -> load distribution.
There you will see a response time of the individual application
servers.
clip_image032
clip_image034
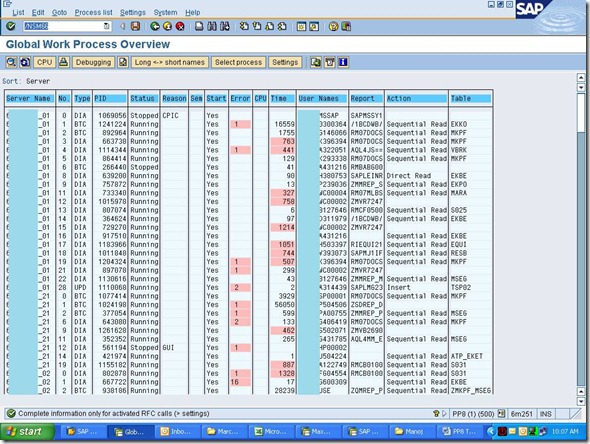
SM66

Global Work Process Overview
This transaction code gives you the detail of the work process which are not local or just say its for the whole system or the active instances in the system.
Check the CPICIPJSR and CPICIPPUN user, if any user got stuck more then 500 ms check the jobs and take necessary action
Check for NRIV table.
Check that processes should not stuck on particular table, if yes; mention Table Name and the number of processes
Check Number of queries running > 1500 sec
clip_image036
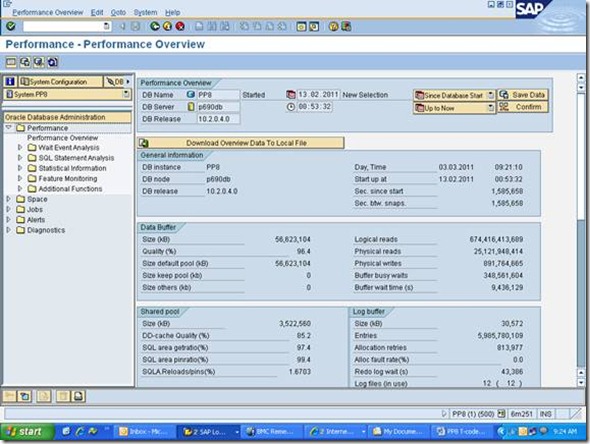
ST04

Performance Overview DATABASE PERFORMANCE OVERVIEW
Buffer quality
DD cache Quality
clip_image038

ST06

Average Server Workload
To exclude performance problems being caused by other components outside the database, you should also use transaction ST06 for analysis. With this transaction you can see whether performance problems are caused by too much strain on the hardware (CPU, RAM).
In the menu Detail analysis menu -> Daily averages -last 30 days -> Display within server you see the average workload of the server.
clip_image043
 
Check:

  • CPU utilization

  • Memory utilization

  • Swap space utilization


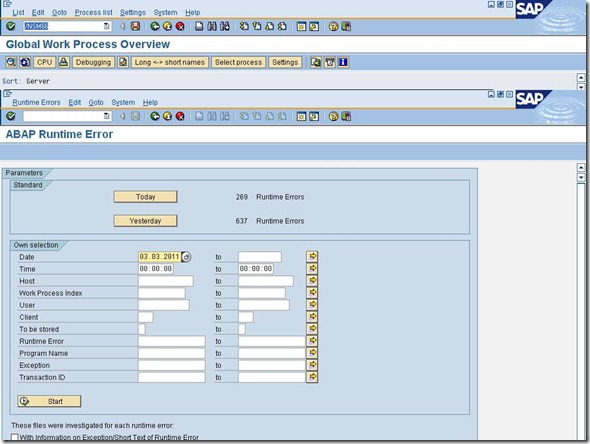
ST22

We can use the tools of the ABAP dump analysis (ST22) to list the ABAP runtime errors that have occurred in an ABAP system as well as the relevant short dumps.
Call ABAP Dump Analysis, either by calling transaction ST22 or using the Easy Access favorites.
Choose the System menu, and then the option
User Profile -> Own Data
clip_image048
WE02

Used to Display IDoc list.
clip_image050
ST03N

Statical Files Deletion (ALTERNATE DAYS)
The following are important analysis views in transaction ST03N:

  • System load overview: general response time distribution across different task types
  • Time profile: How does the response time react over the day? Are there peak times with bad response times?
  • Transaction profile: Can you observe response time problems in general or only in certain transactions?


clip_image052


  • Switch to expert mode
  • Go to collector and performance
  • Go to delete files

SAP BASIS Transaction Codes (T Codes)


T Codes
Meaning
AL01 
SAP Alert Monitor
AL02 
Database alert monitor
AL03 
Operating system alert monitor
AL04 
Monitor call distribution
AL05 
Monitor current workload
AL06 
Performance: Upload/Download
© Copyright Full SAP BASIS
Back To Top